We've got your back
Sterling Trader® Pro Guide
Sterling's user manuals are continuously updated digitally. Explore the step-by-step resources in the product user guides to sharpen your trading & risk management skills.
Sterling's user manuals are continuously updated digitally. Explore the step-by-step resources in the product user guides to sharpen your trading & risk management skills.
Note this menu can also be accessed by right clicking within the chart.
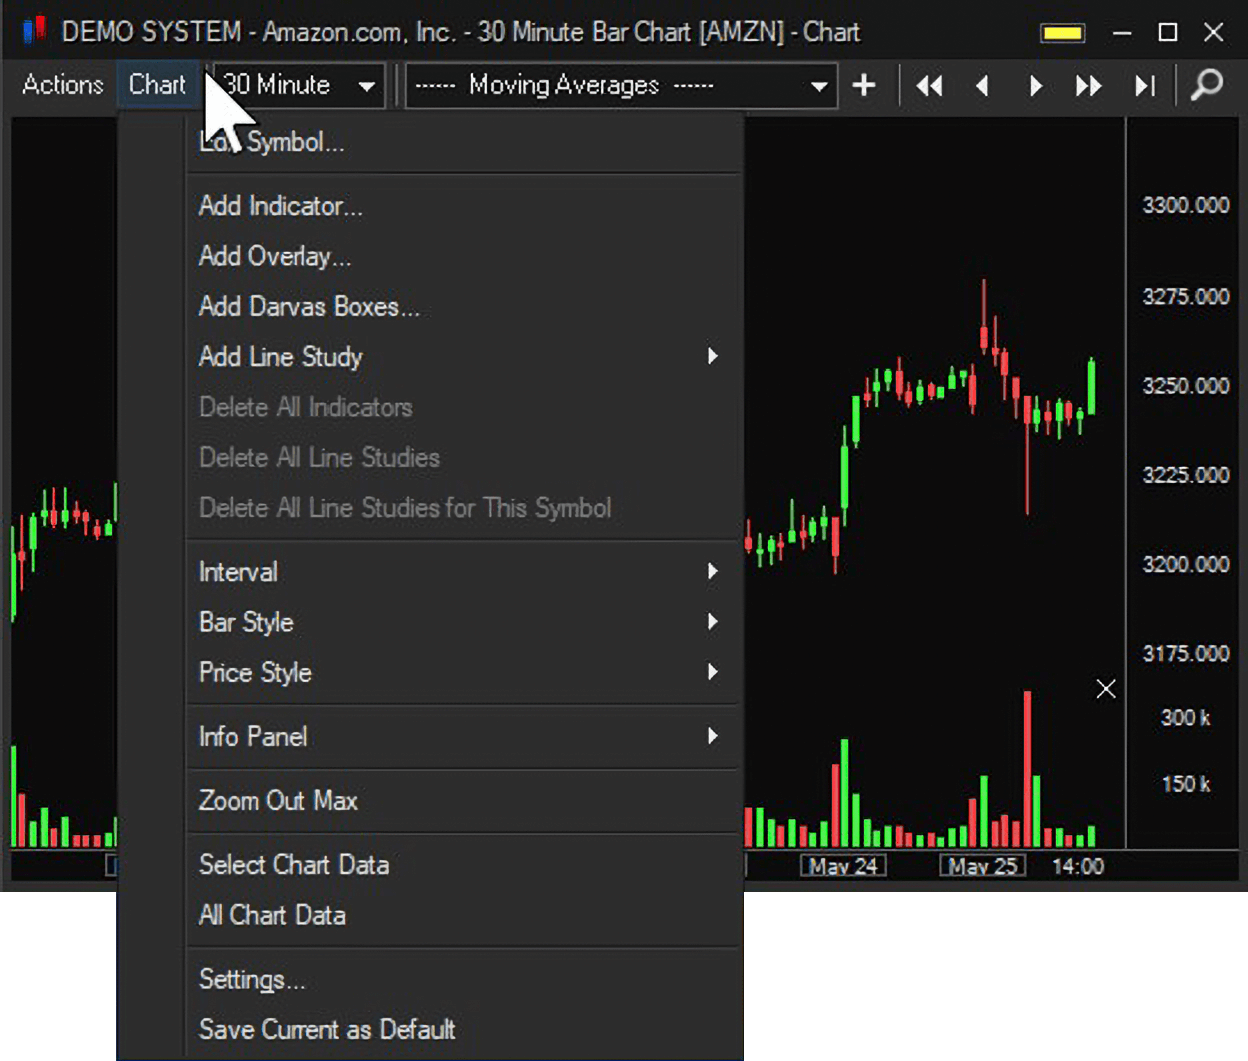
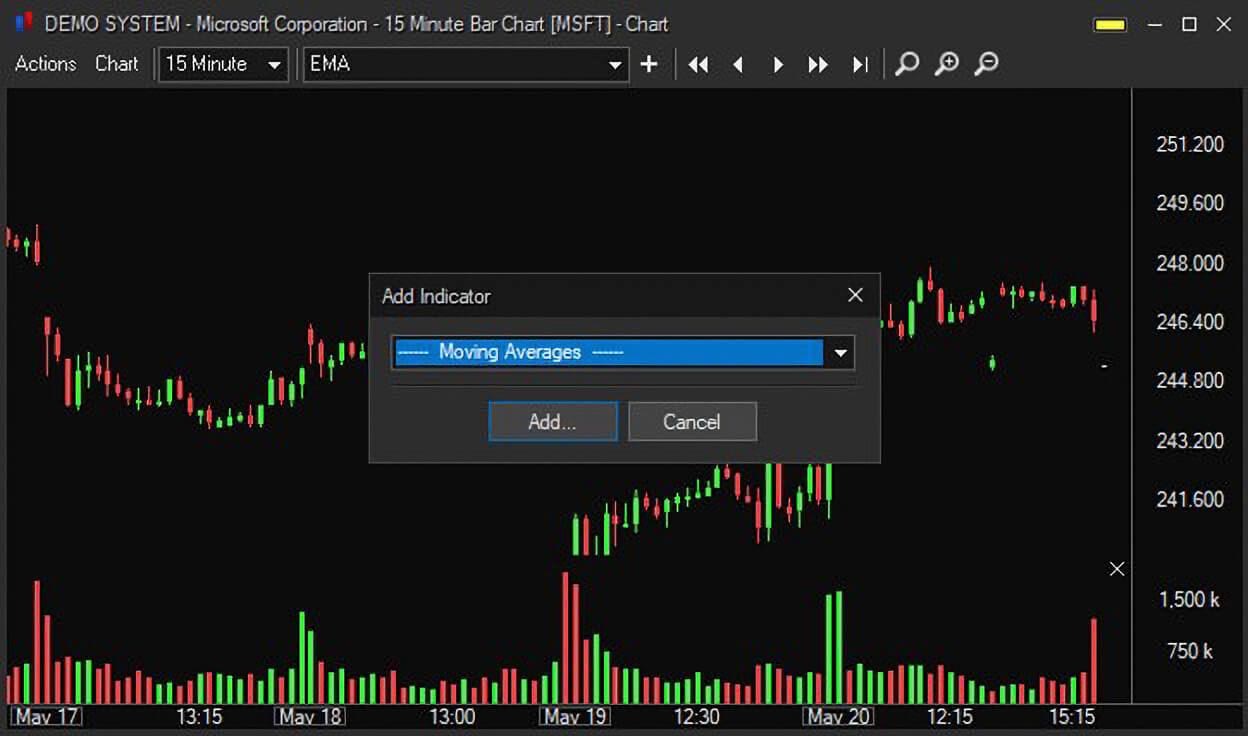
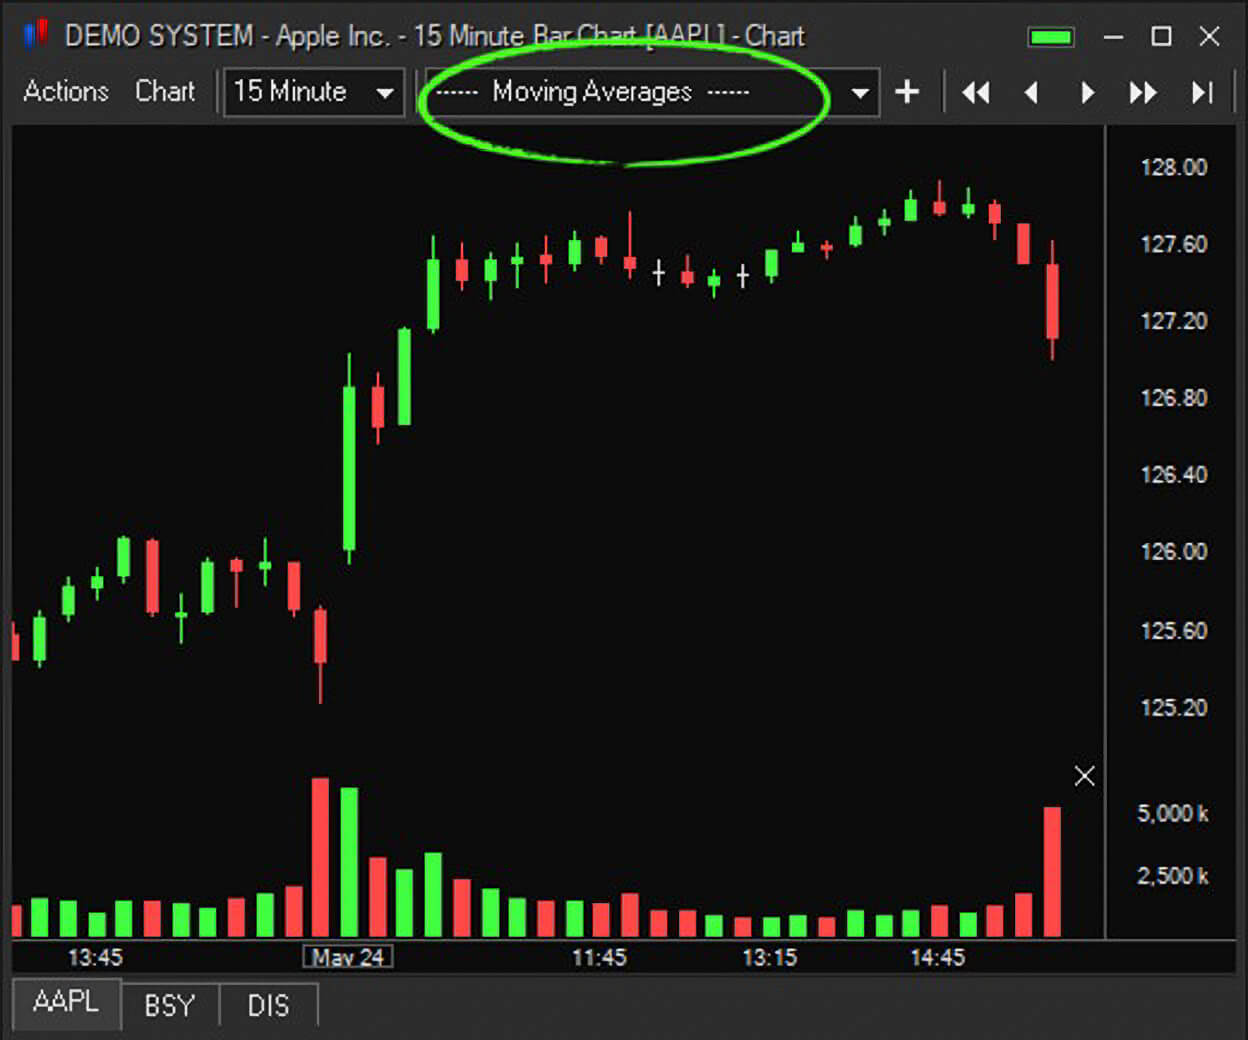
Add Indicator – select an Indicator from the Add Indicator window dropdown menu. The Indicator dropdown menu can also be found at the top of the chart window.
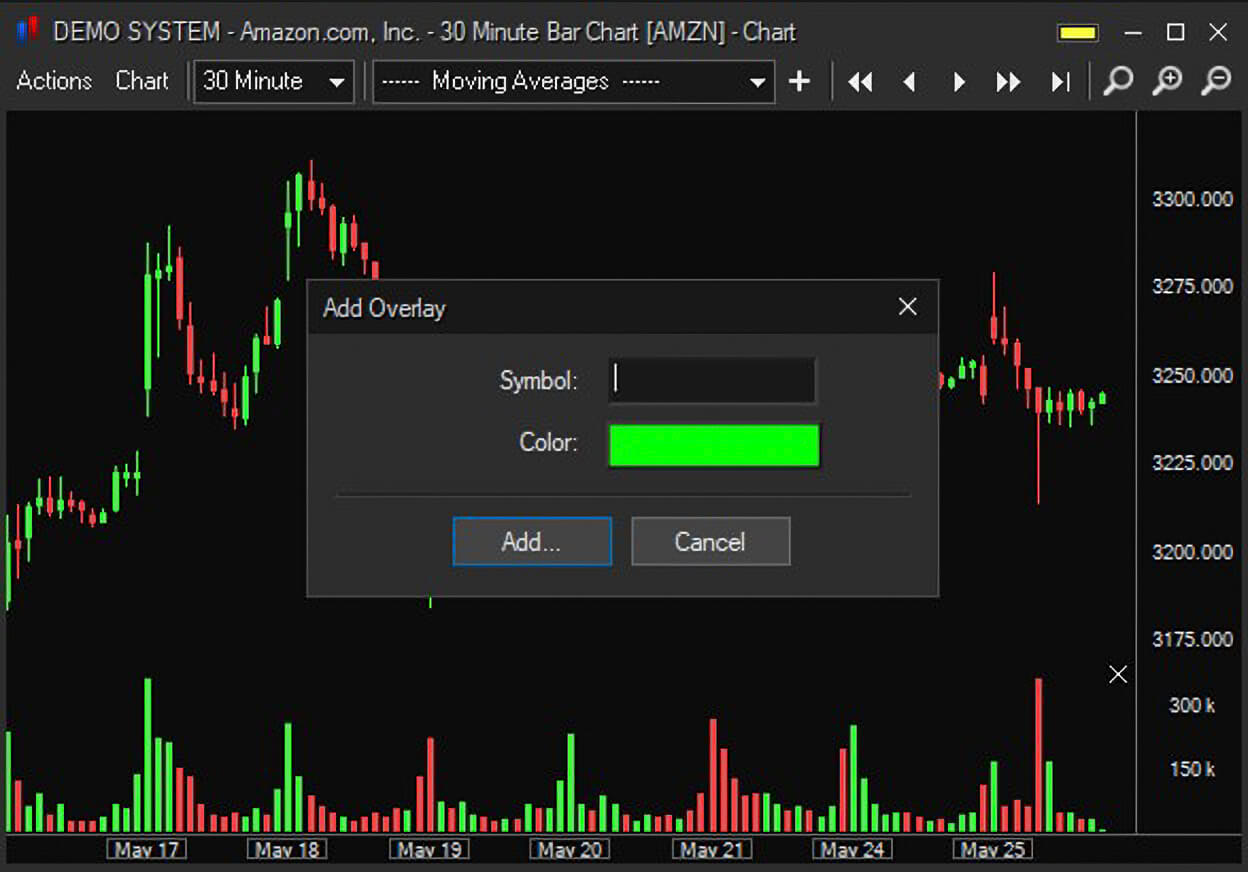
Add Overlay - overlay additional symbols onto a chart.
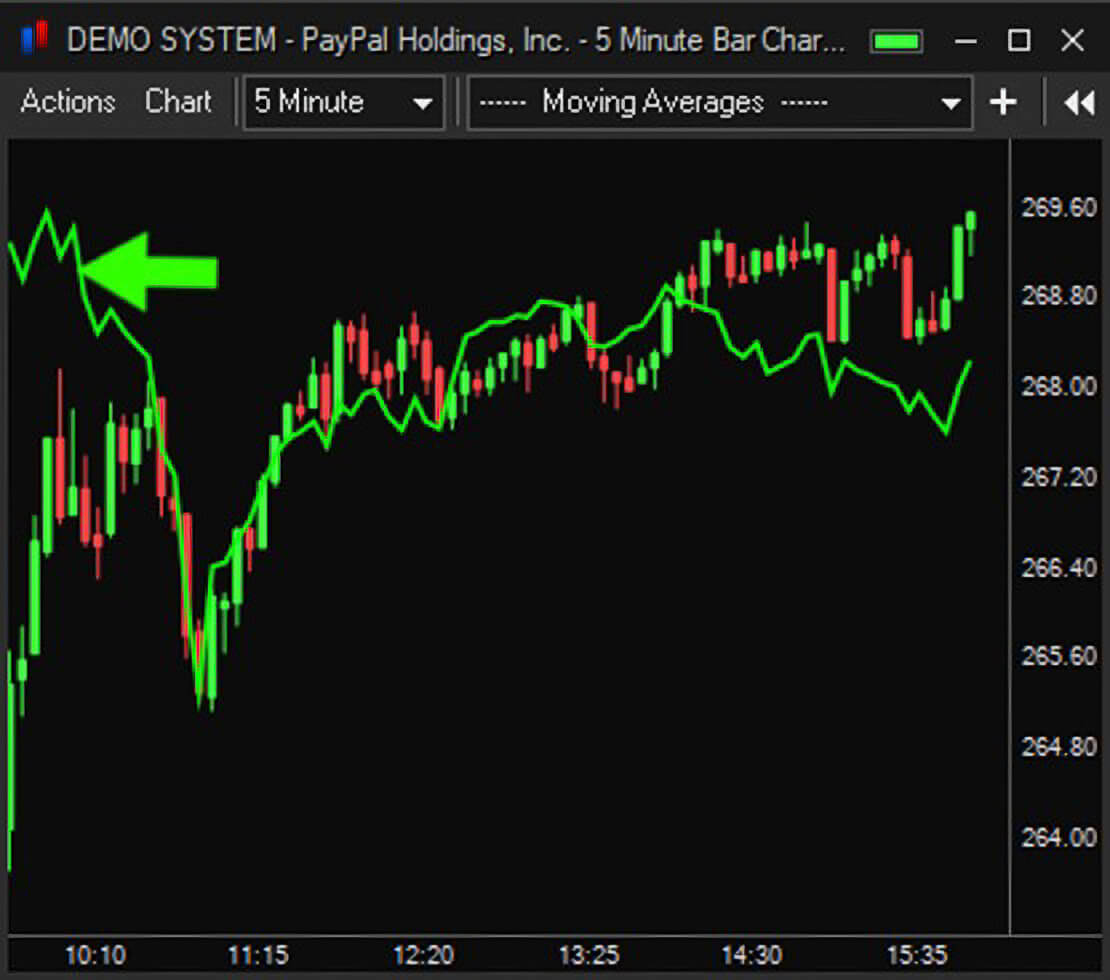
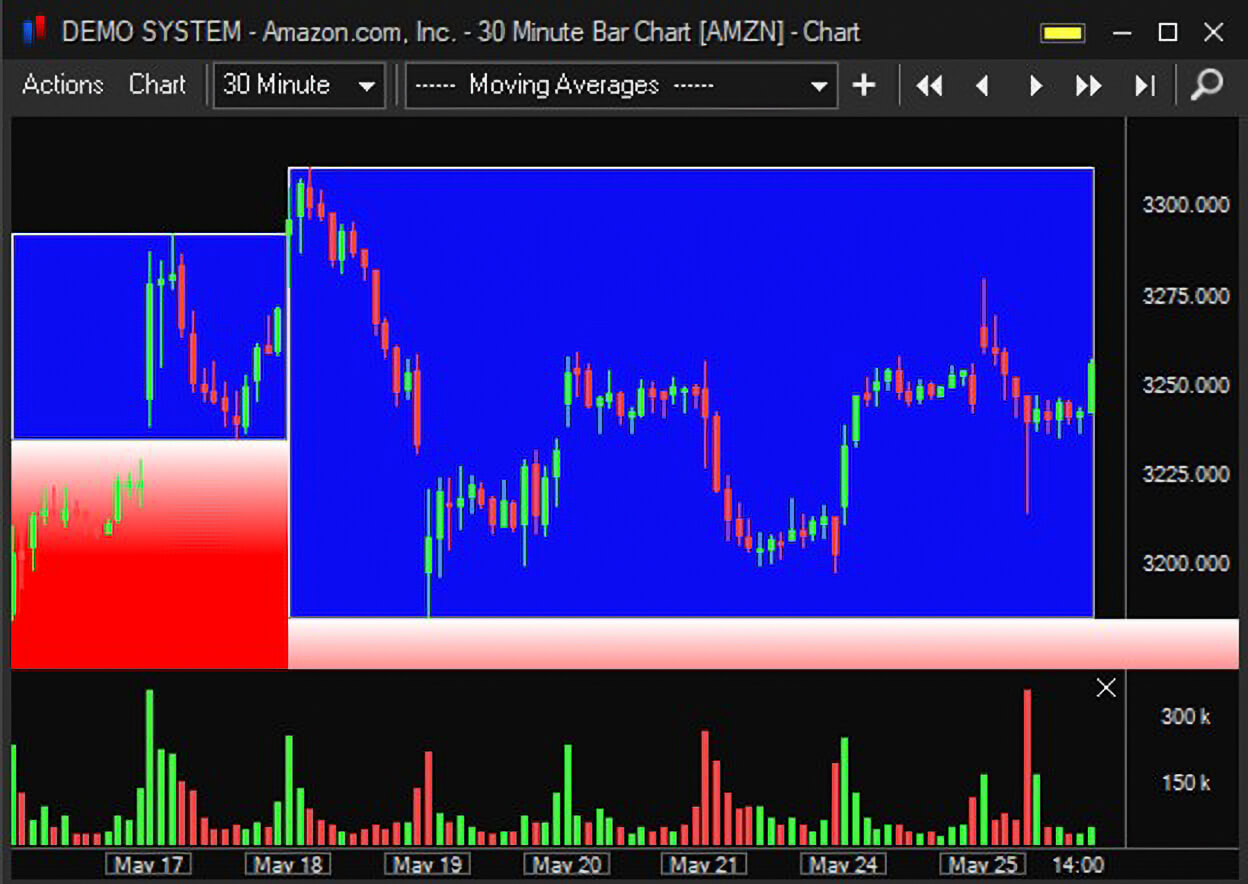
Add Darvas Boxes - add Darvas boxes to a chart.
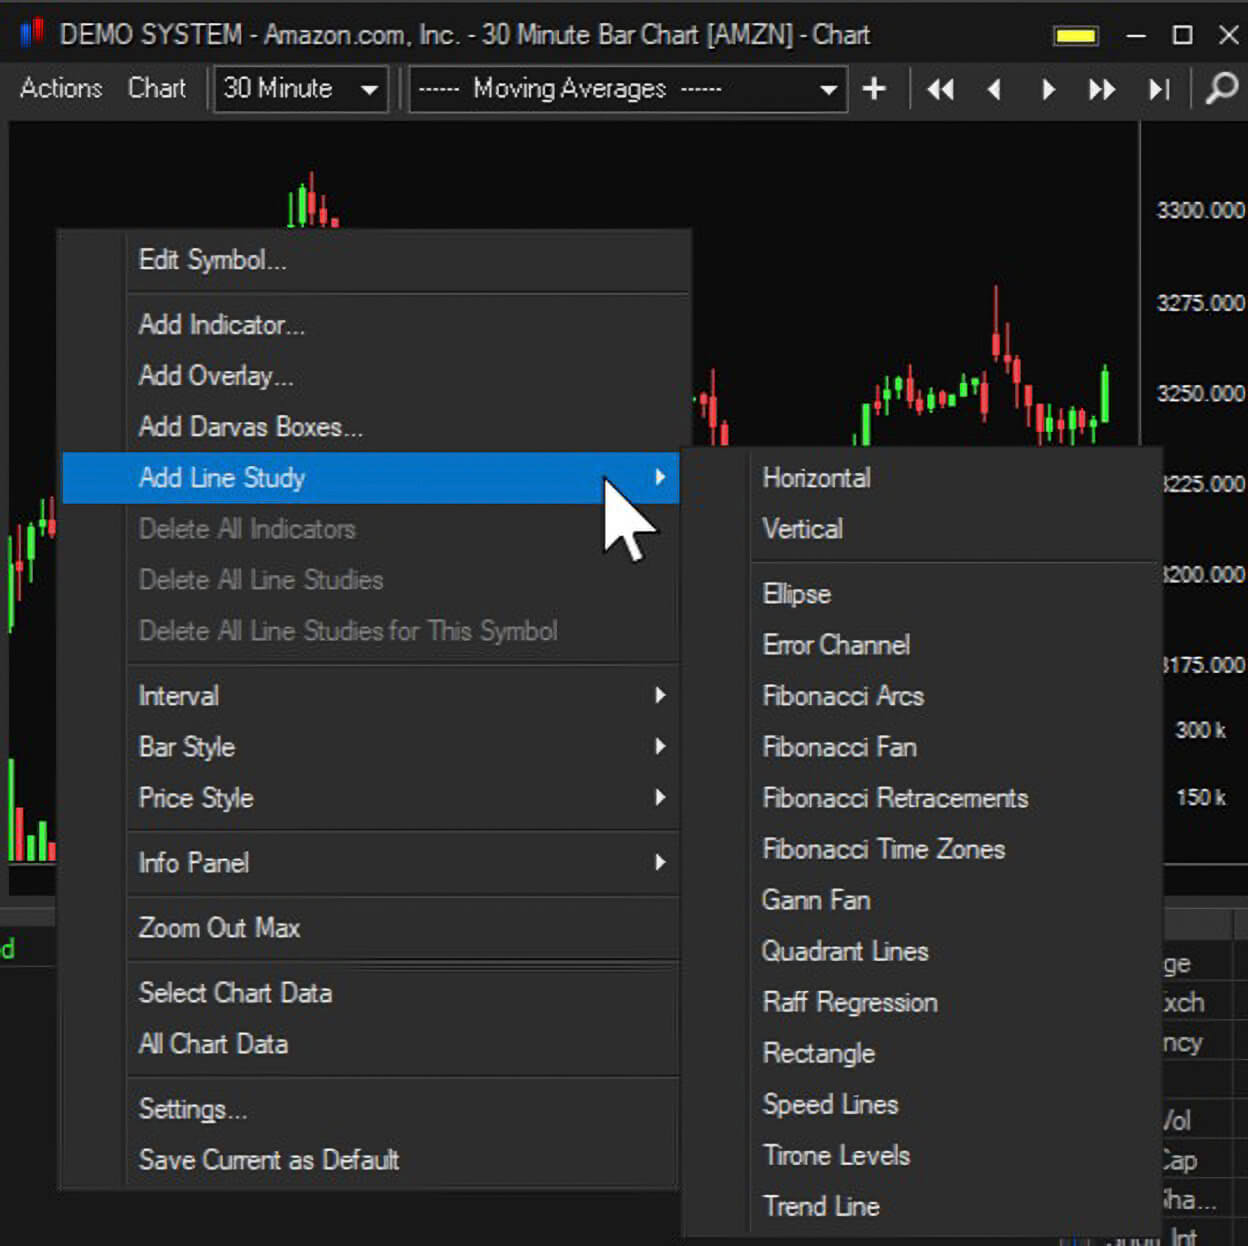
Add Line Study – add a line study to a chart.
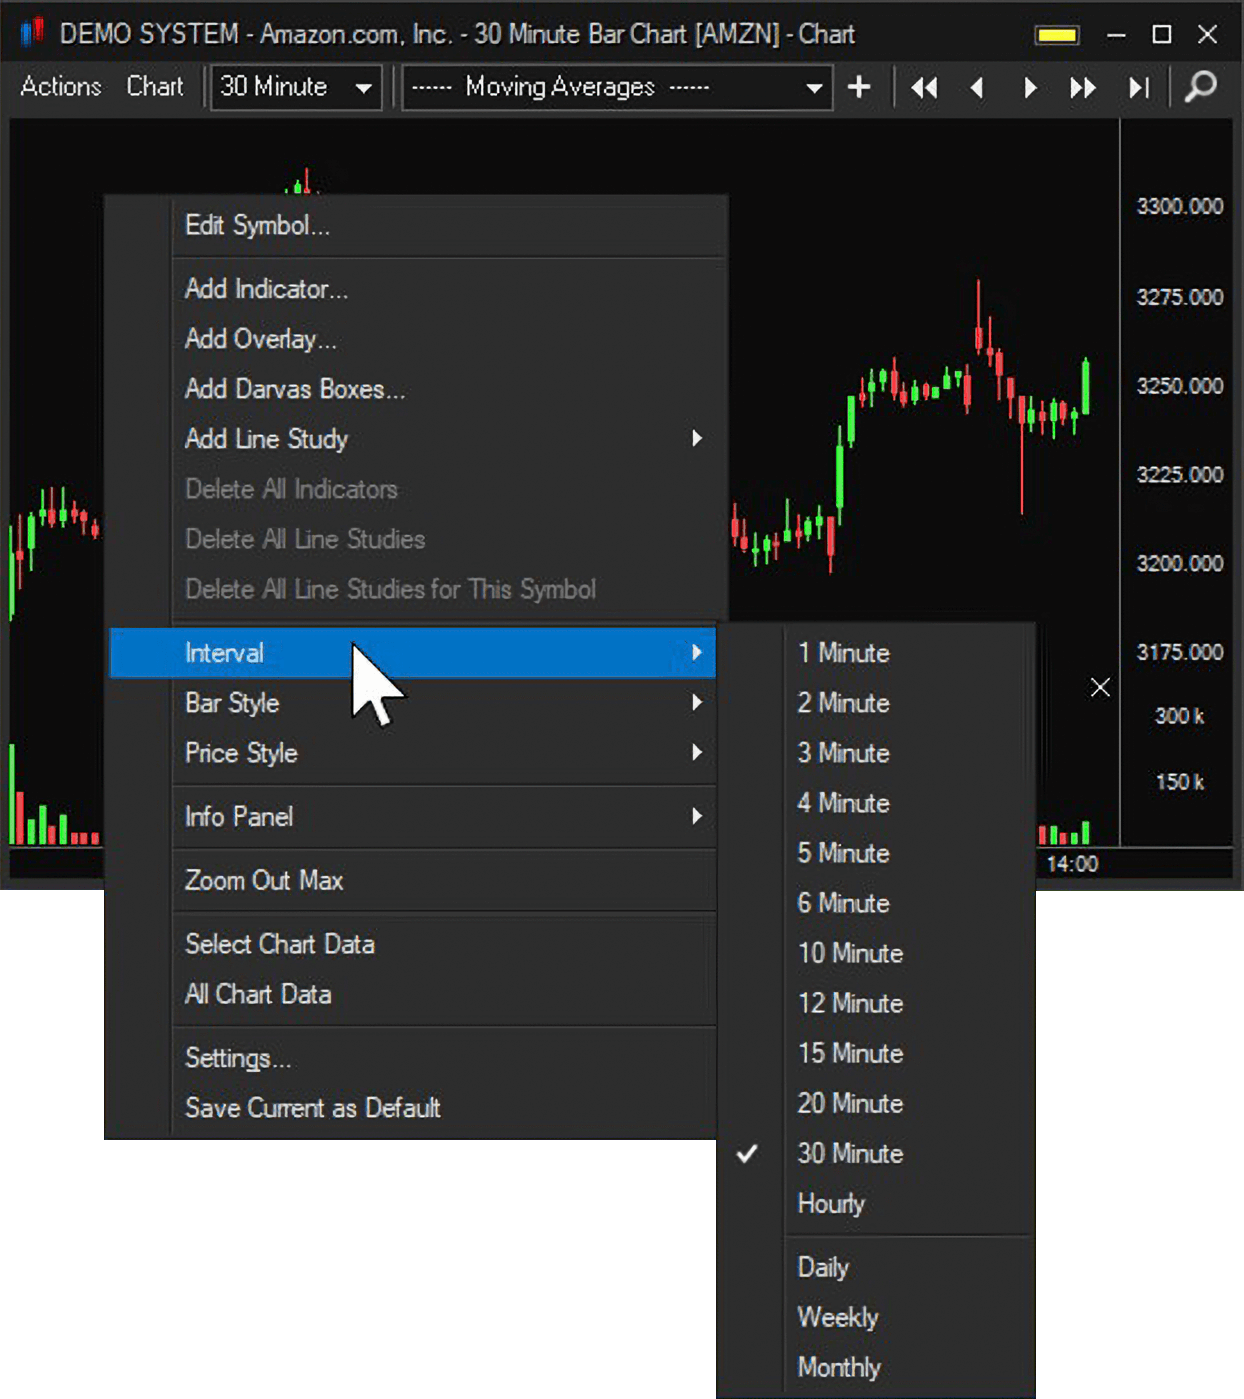
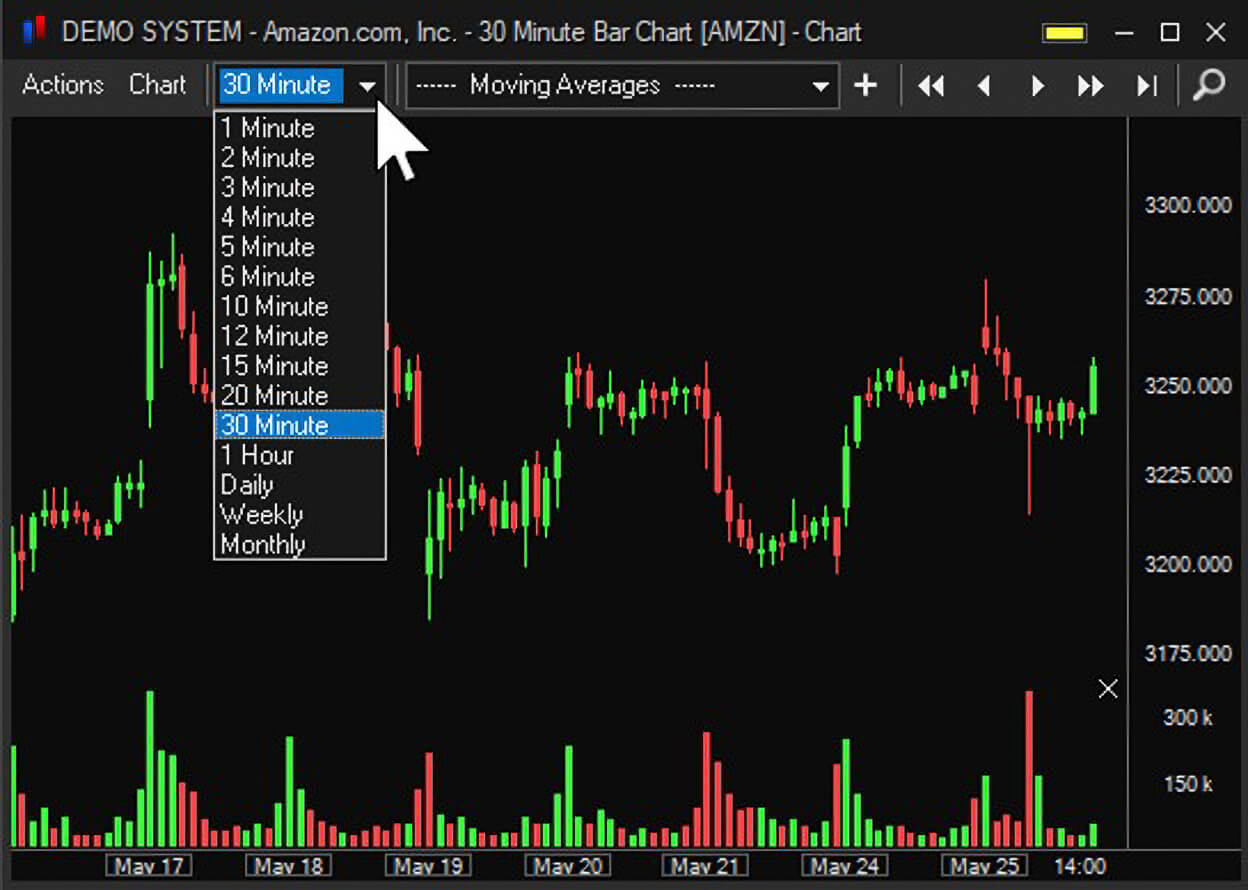
Interval – change the chart interval. The interval menu can also be found at the top of the chart window.
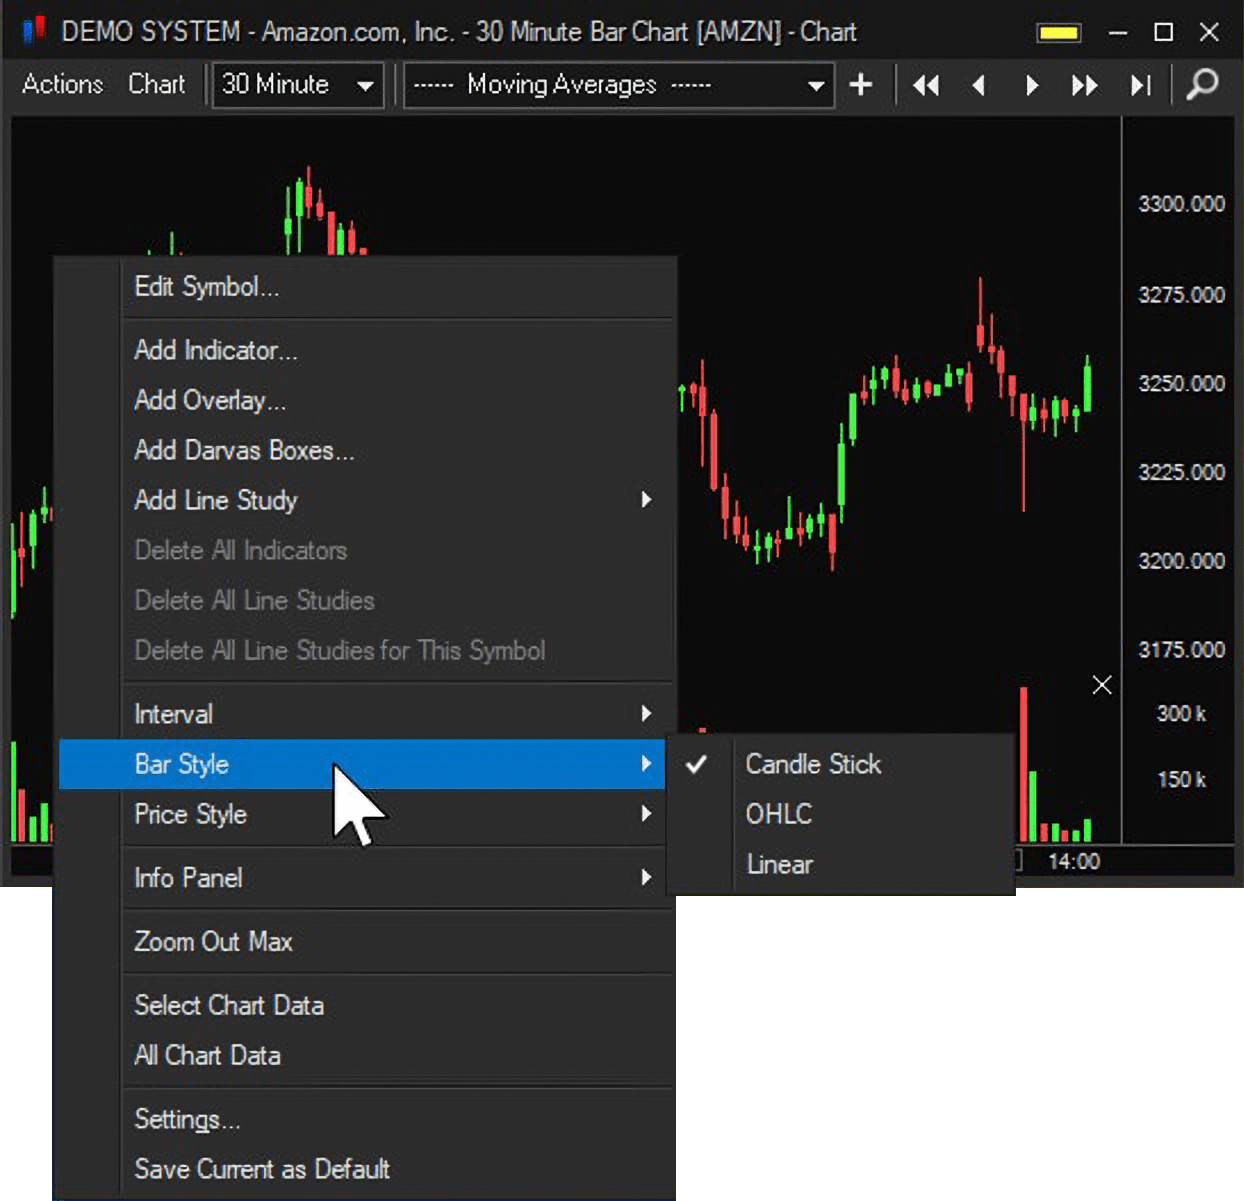
Bar Style – change the chart bar style.
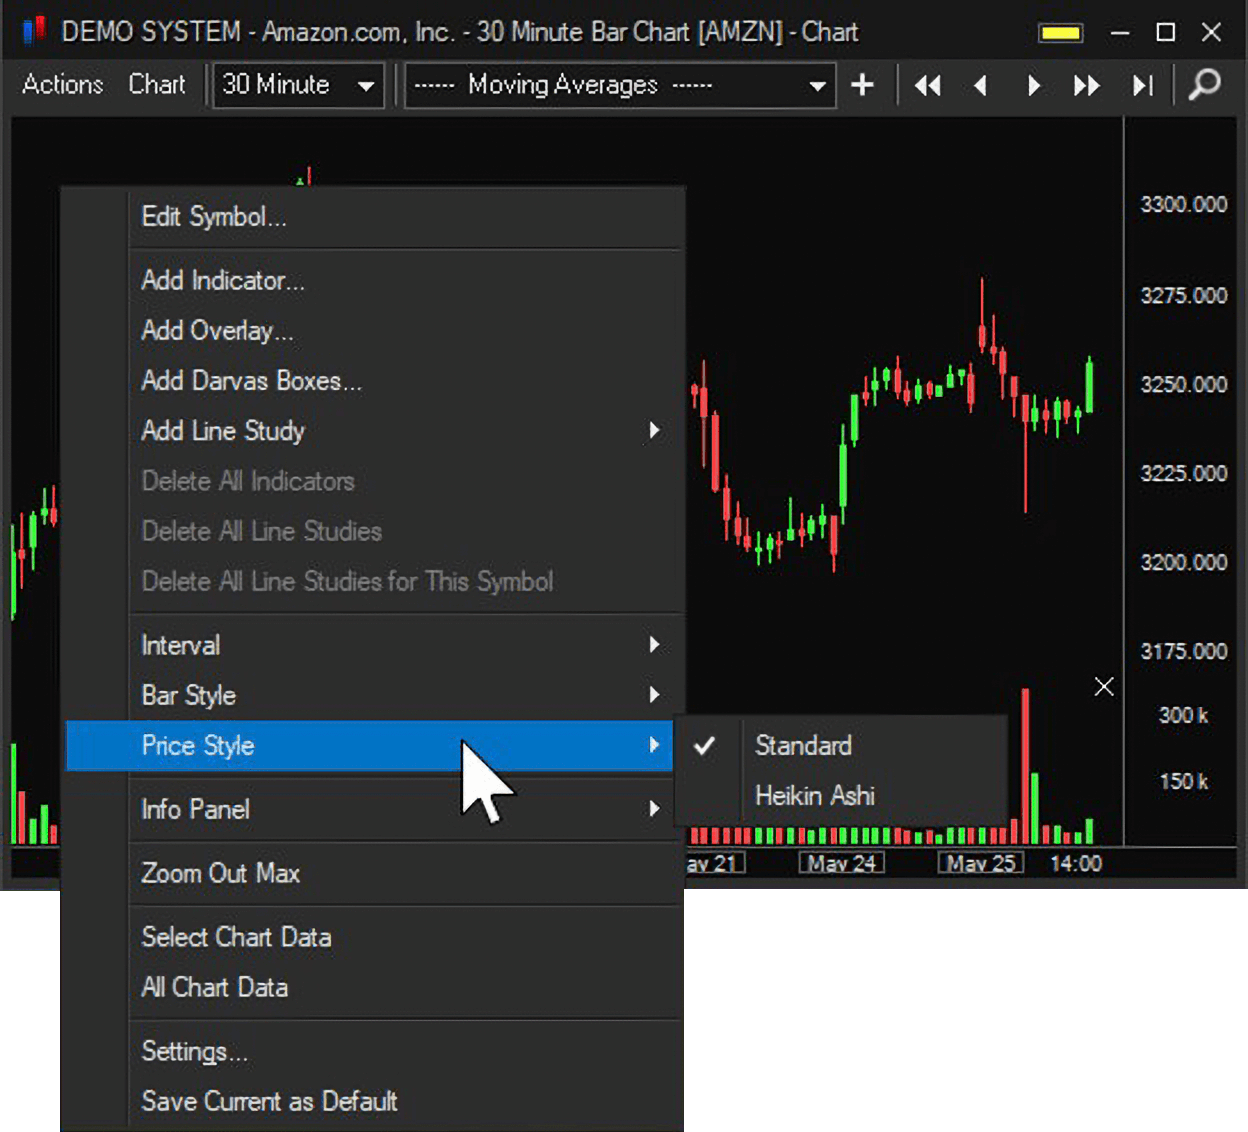
Price Style – change the chart price style.
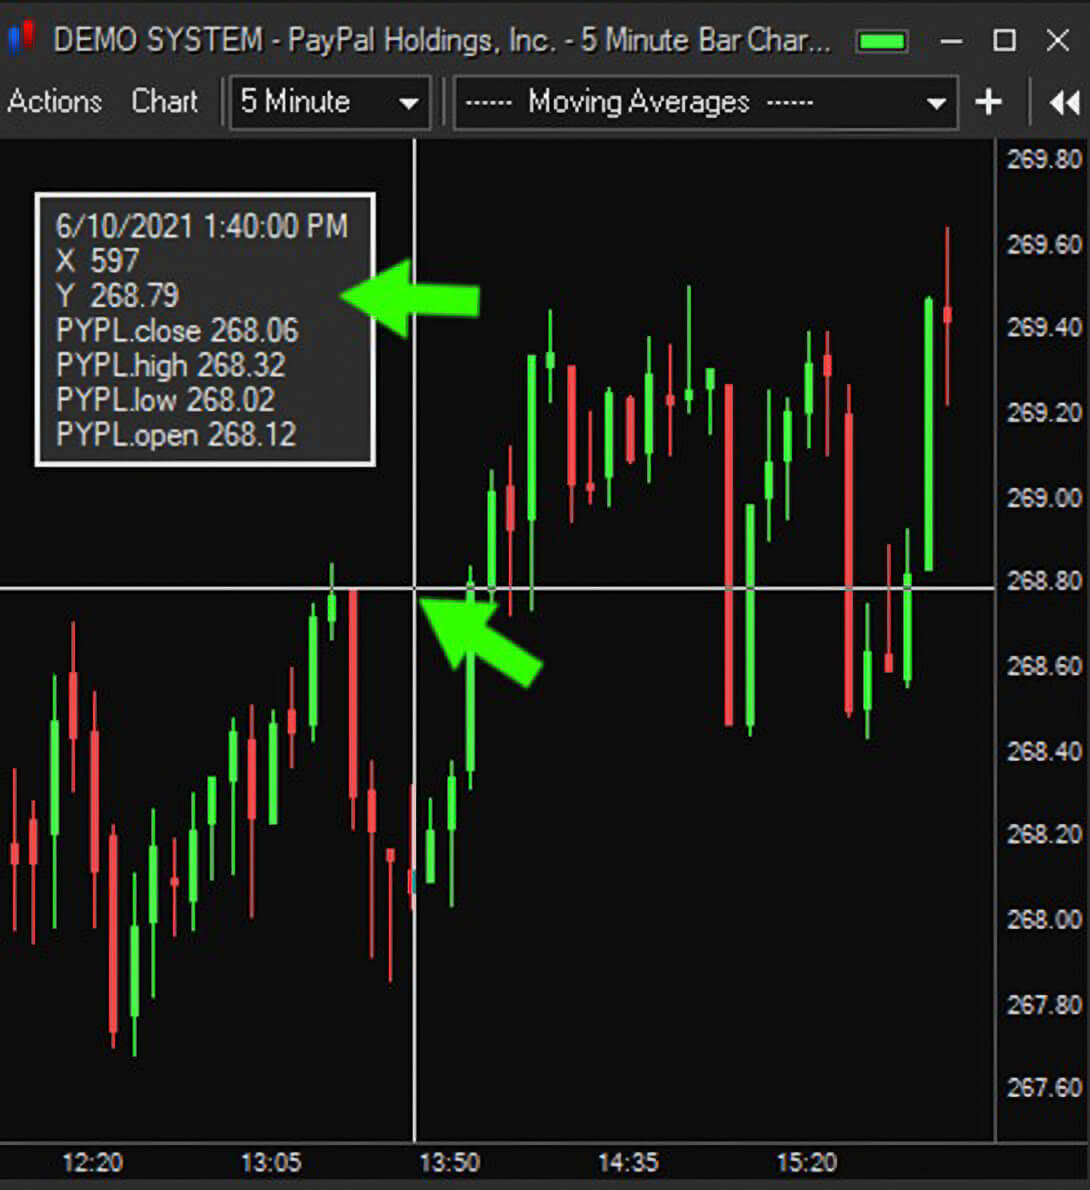
Info Panel – turn the Info Panel off or choose to have it on and Fixed or Floating.
Zoom Out Max - zooms out the chart the maximum amount.
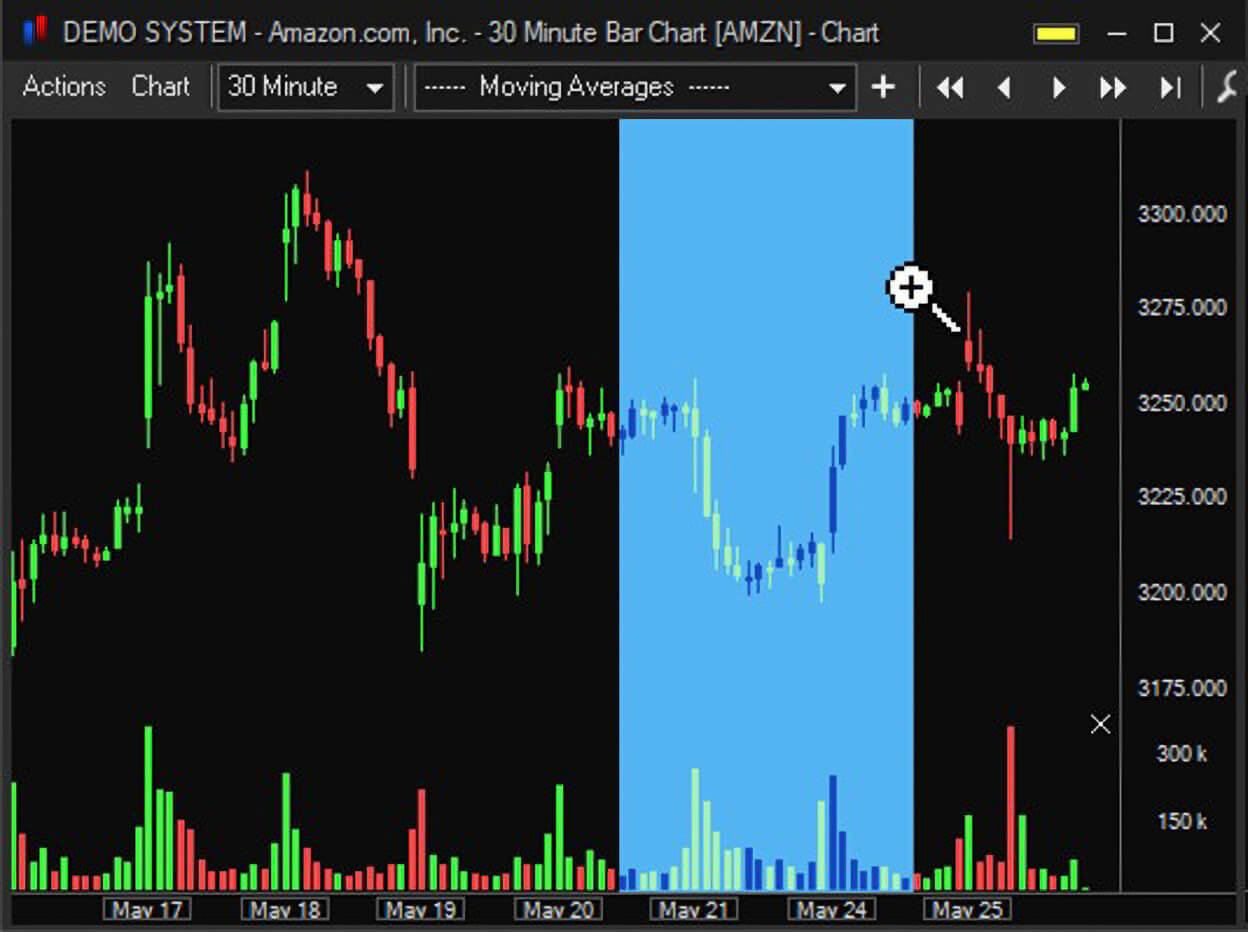
Select Chart Data – left click drag and drop the magnifying glass icon to select a section of chart data to view each candle’s High, Low, Open and Close.
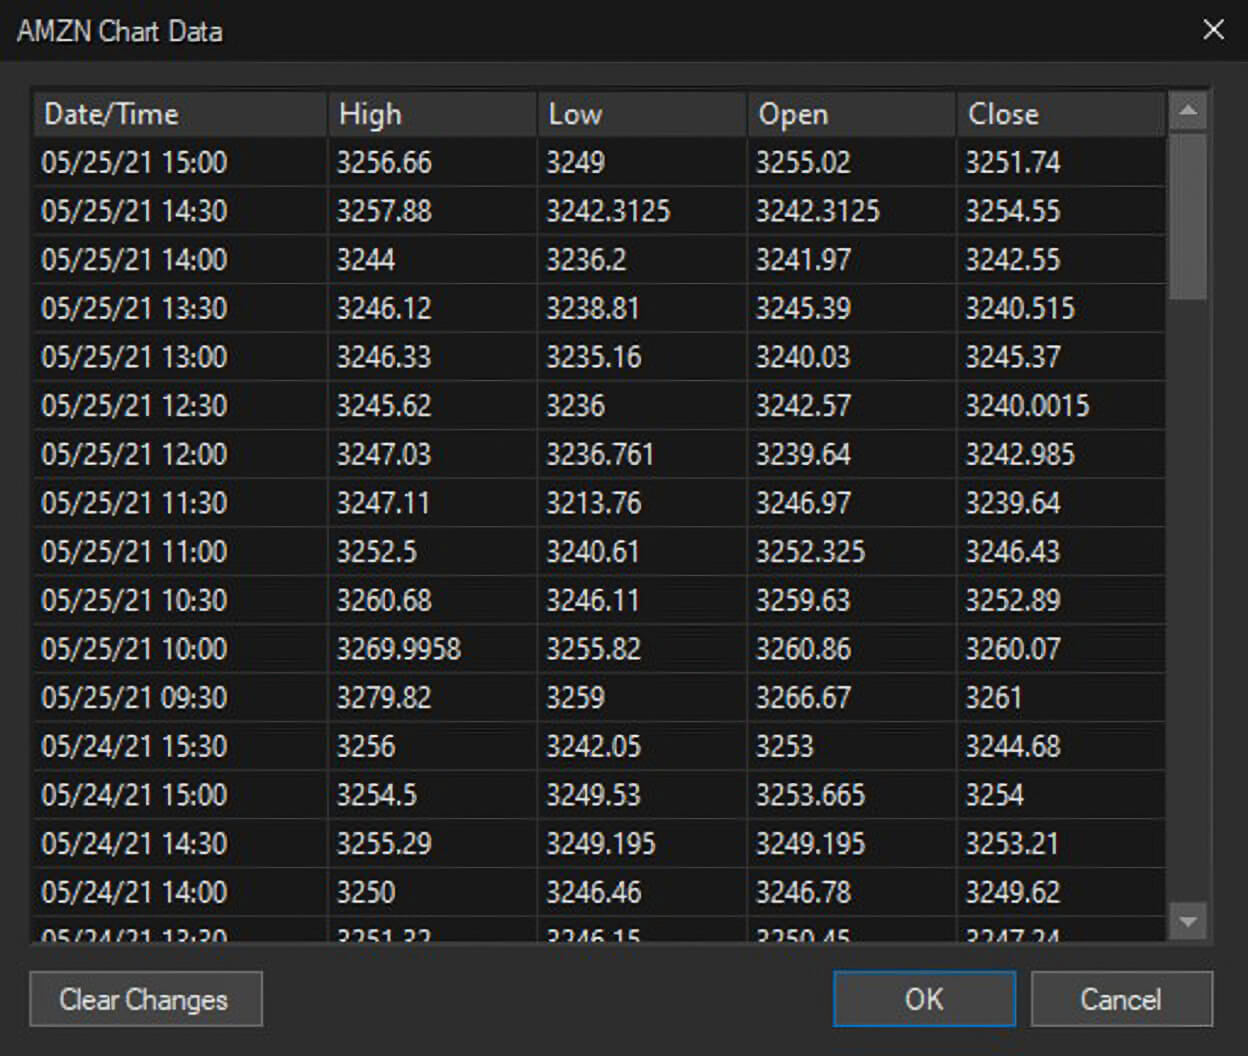
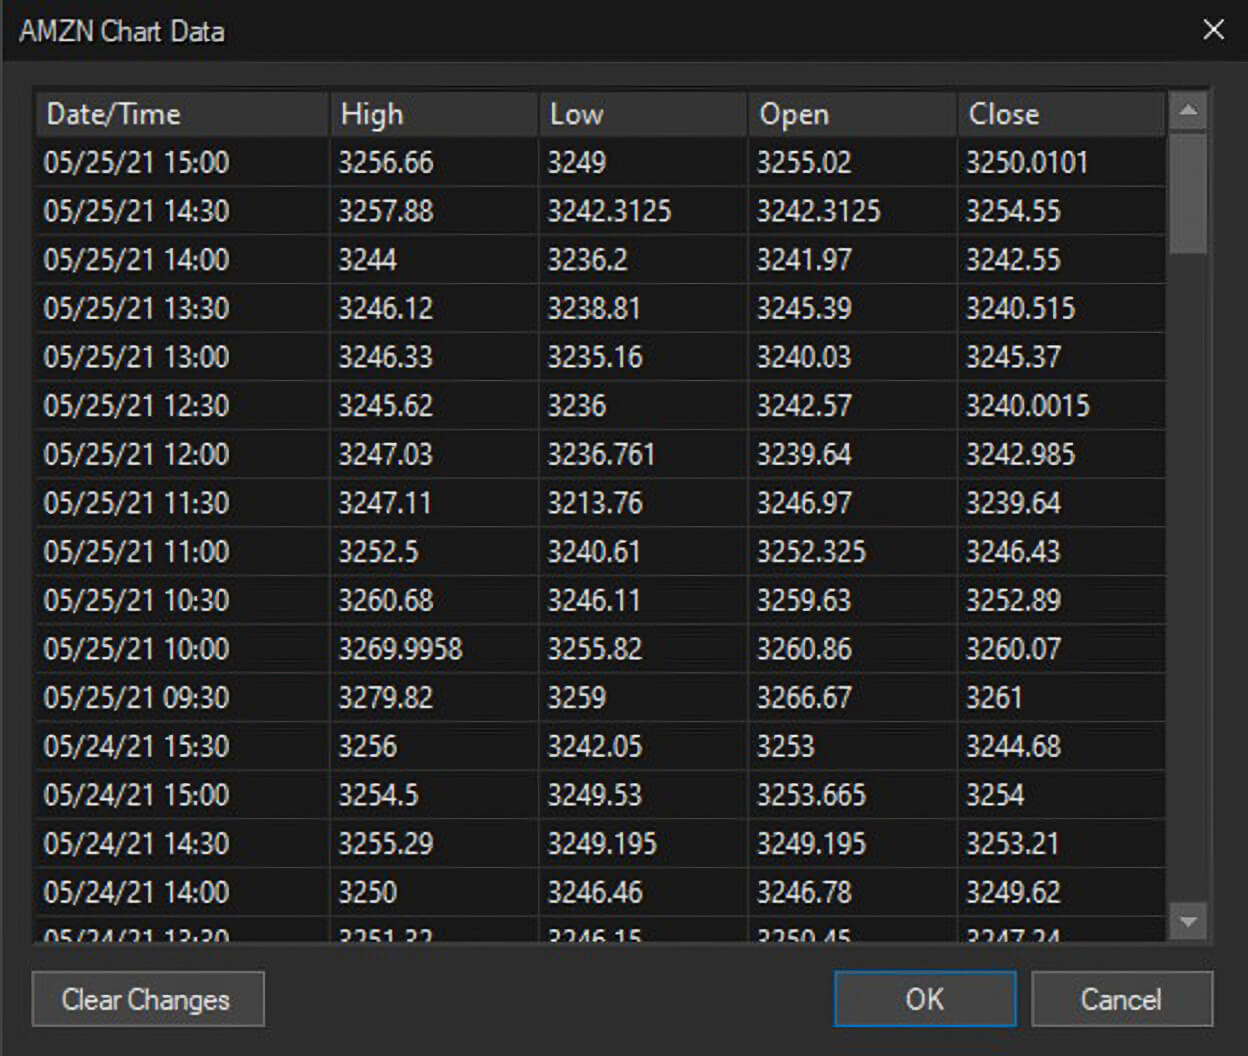
All Chart Data – view High, Low, Open and Close for each candle in the chart.
Settings – opens the Chart Settings menu.
Save Current as Default – saves the current chart settings as the default for new charts.